Chiefs vs. 49ers: Applied Rushing Behavior
This Could Be The Deciding Factor Of The Super BowlIf You’re Short On Time…
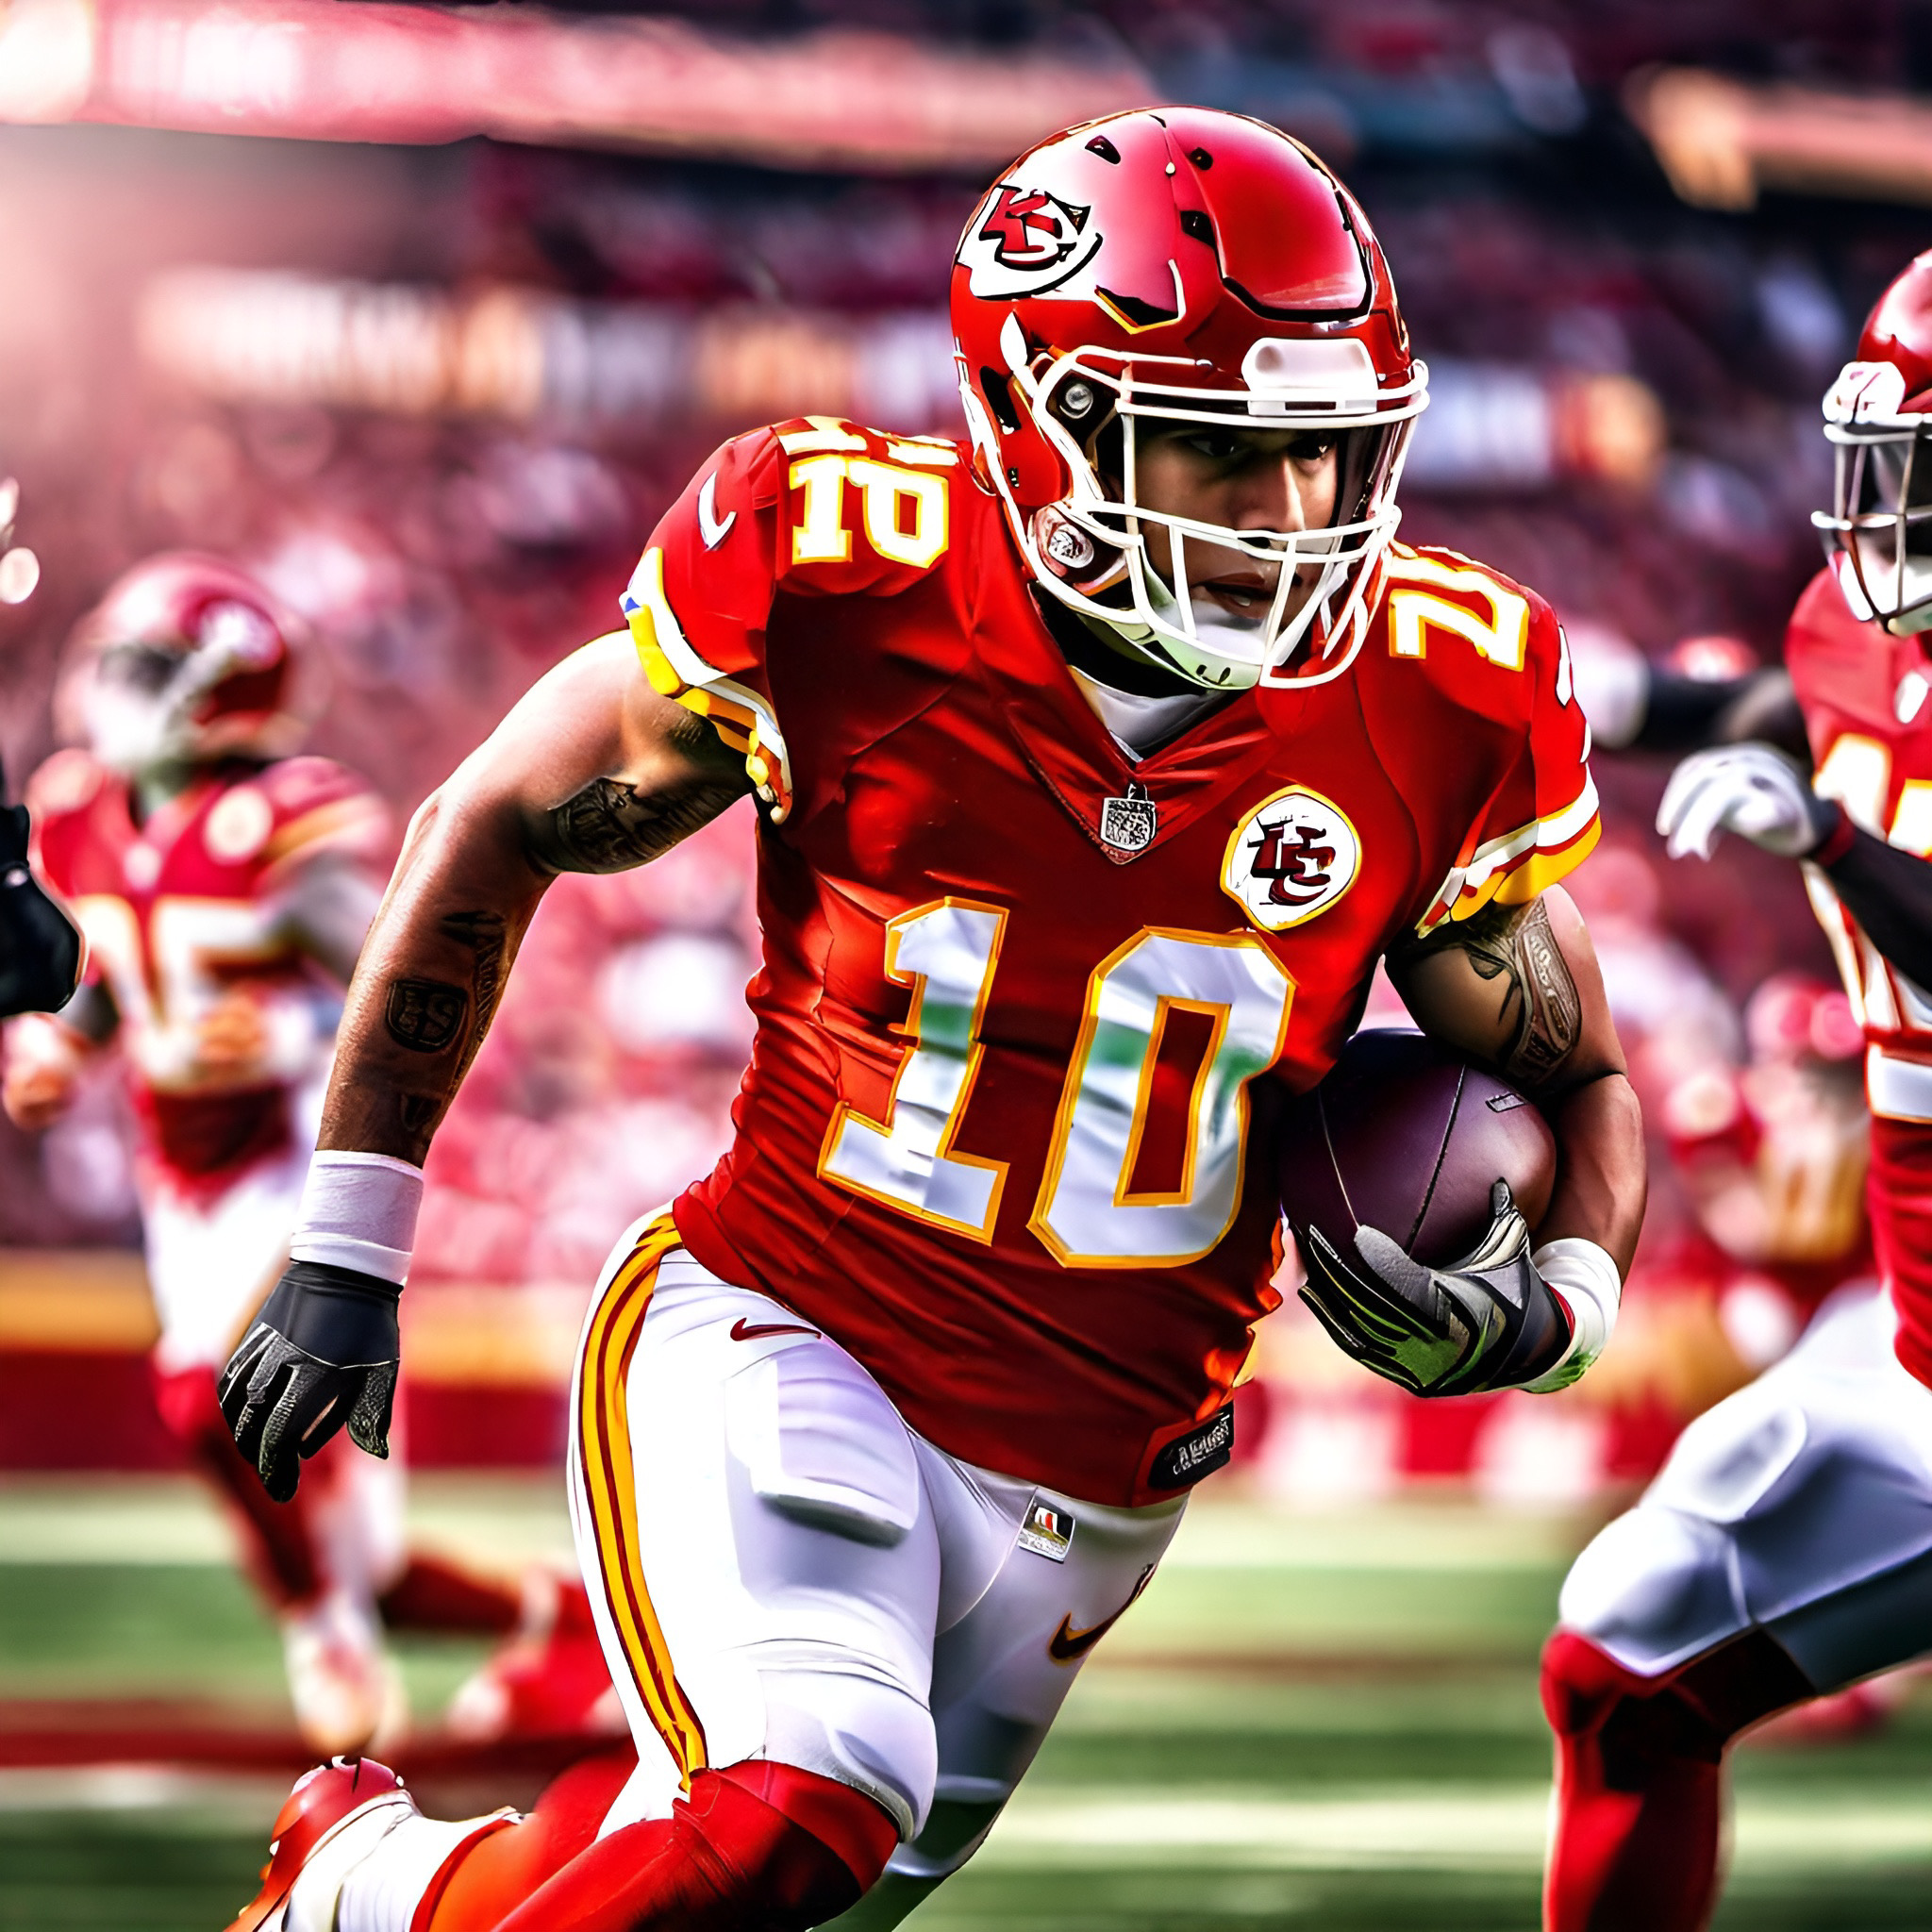
- Chiefs Rushing Offense Got 11% Better After The Bye Week
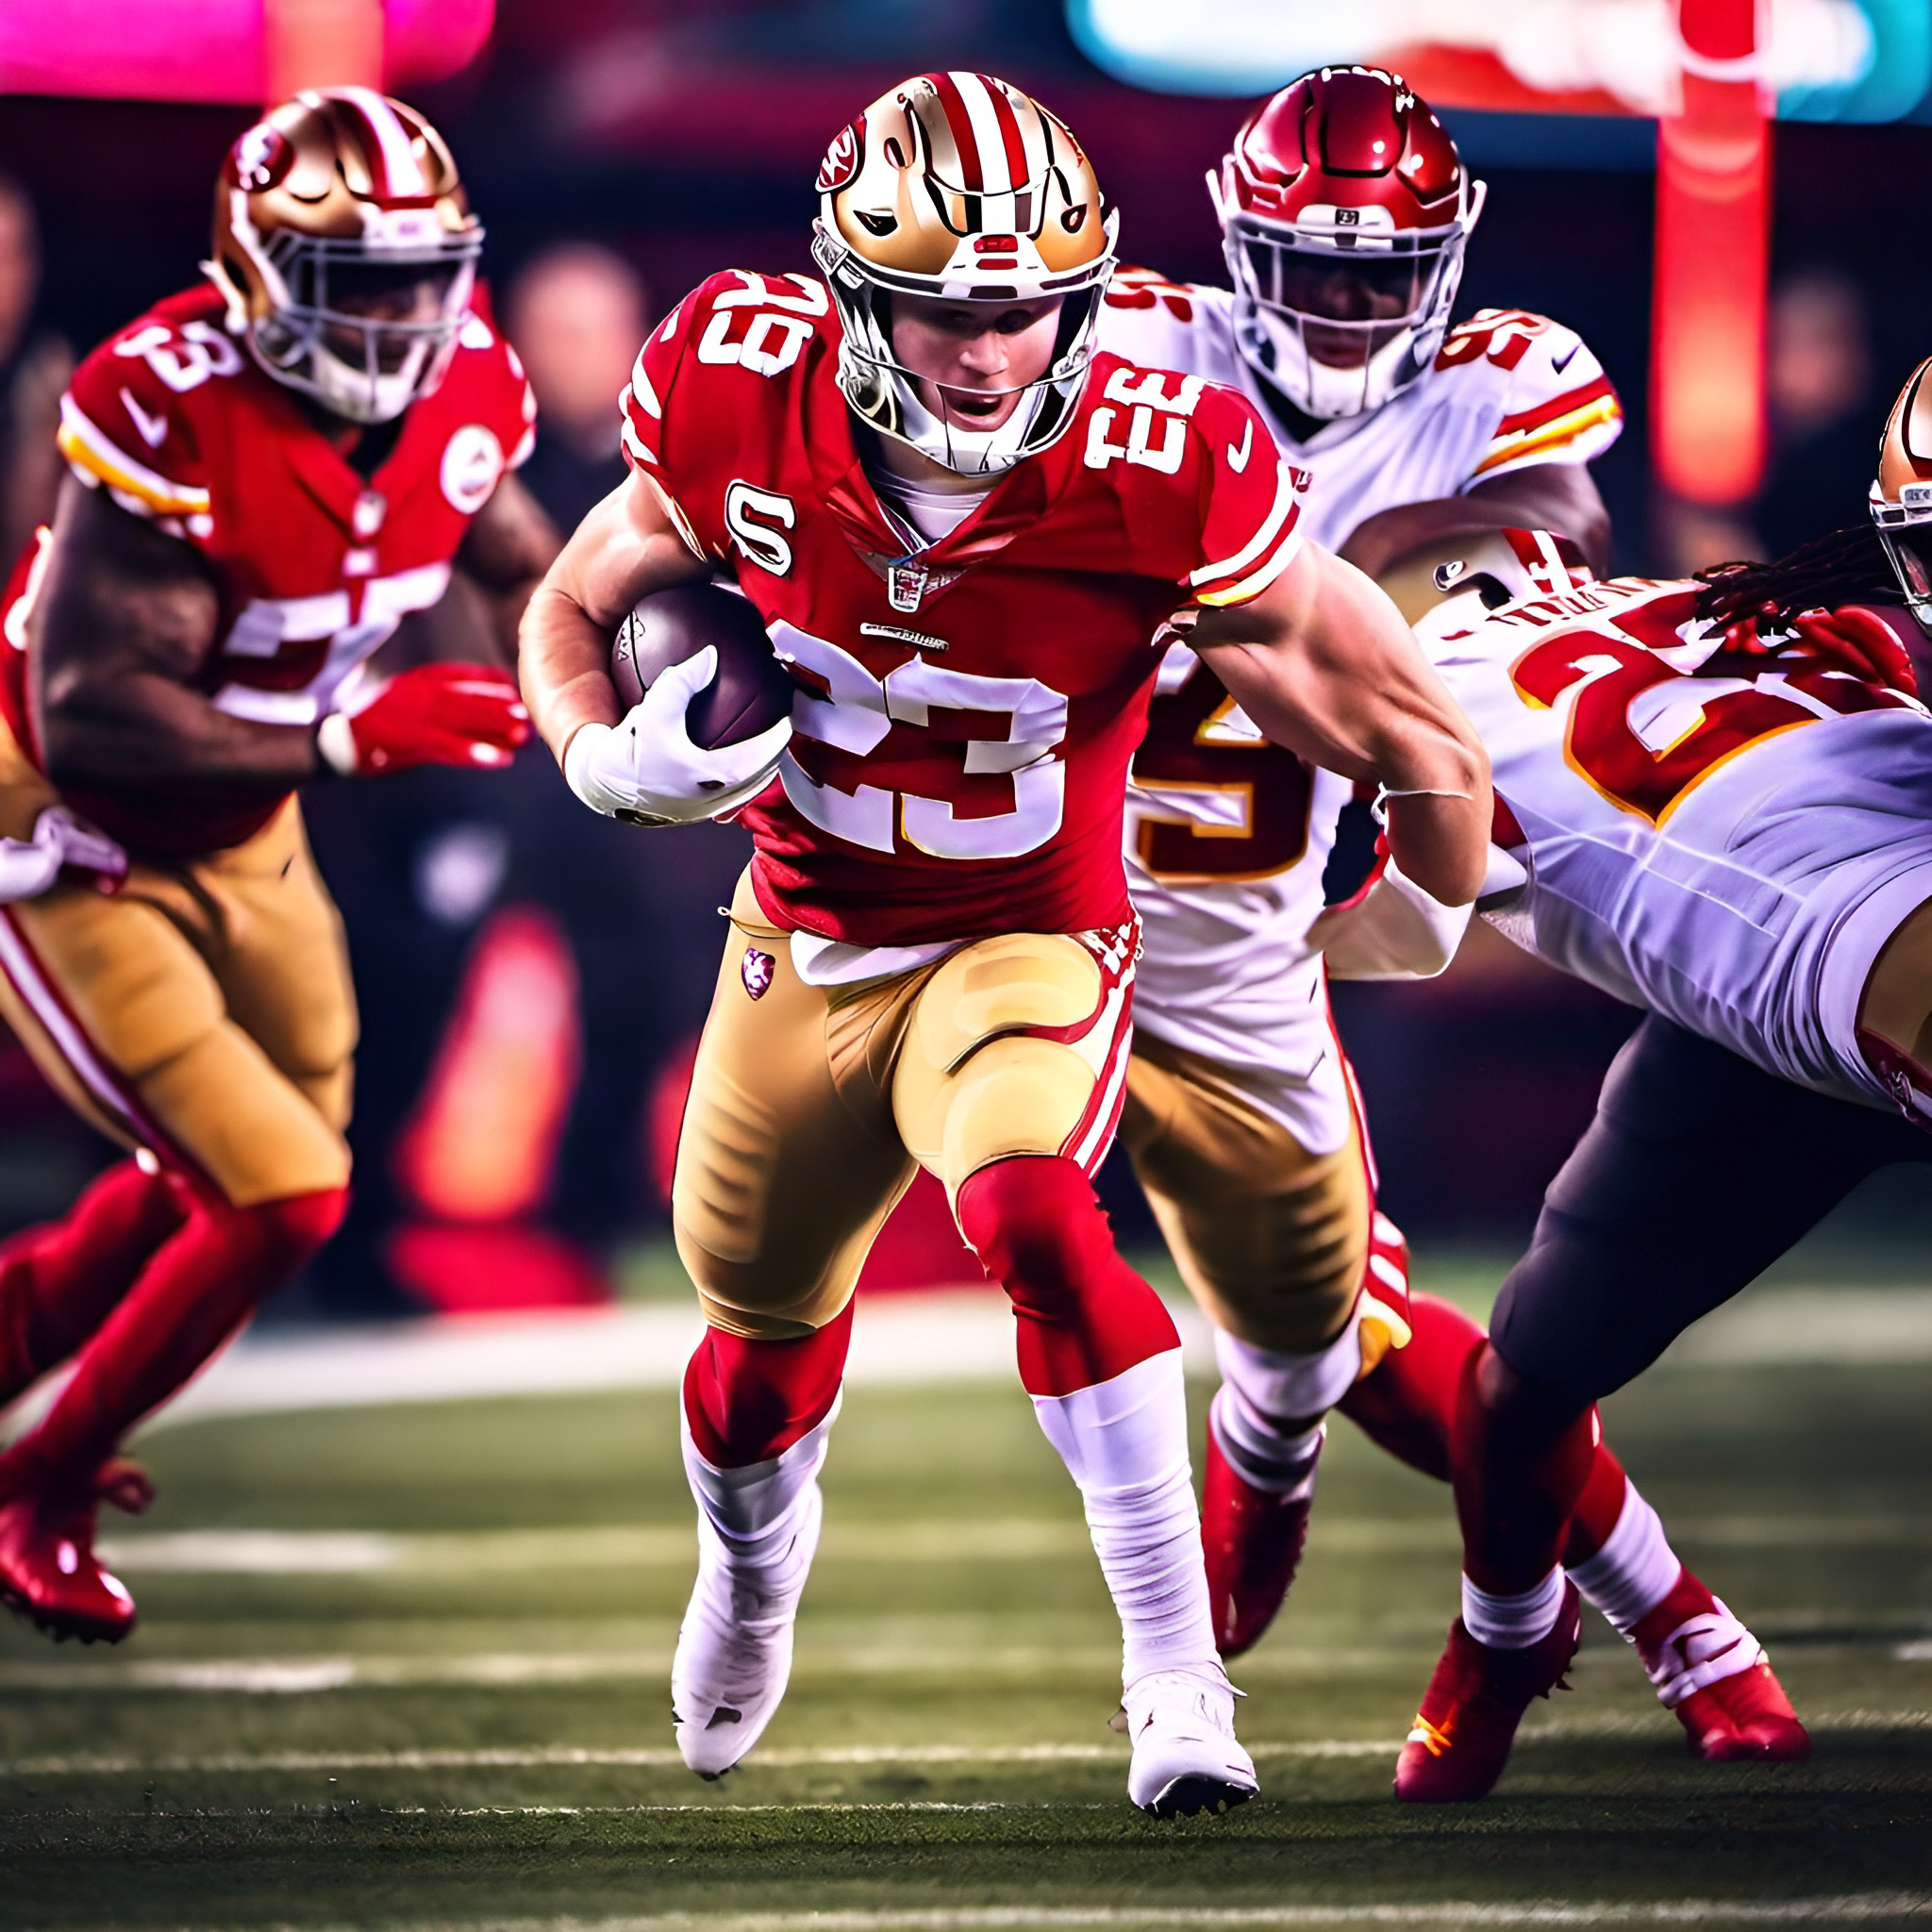
- 49ers Rushing Prowess Evident, 13% Better After Bye Week
- Chiefs Defense 10% Better After Bye Week
- 49ers Defense 24% Worse After Bye Week
- FULL Super Bowl RB Prop Predictions For Subscribers, Enter Your Email Below
NFL Analytics: Super Bowl Applied Rushing Behavior
Applied Rushing Behavior is the measure of rushing behavior, in terms of yards, touchdowns and fumbles, on a per minute of possession time basis.
Keeping in practice with the first law of football behavior (an offense’s primary responsibility is to score points, and they can only score points when they possess the ball), running the ball makes up usually 40-50% of a teams offense (some teams run it as low as 32% of the time or as high as 56% of the time) in order to the move the ball down the field and score points.
How efficient they are at using the rushing attack to score points is what we are measuring.
Reminder: the rushing attack is a total team effort. As such, we typically assign this data to team offenses and defenses, rather than individual players, like the running back. The offensive line plays perhaps the largest role in rushing success. In order to assign value to individual players based on performance, we would need to make assumptions about responsibilities and scheme that no one can make unless you are on each individual team.
So, in the interest of objectivity and accuracy, we keep it to team focused. At the end of the day all that really matters is which team wins the game.
Applied Rushing Behavior examines several rates: Rushing Yard Behavior Rate, Rushing Touchdown Behavior Rate, Rushing Fumble Behavior Rate, Rushing Yards Allowed Behavior Rate, Rushing Touchdowns Allowed Behavior Rate, and Forced Fumble (Rushing) Behavior Rate.
This allows us to examine each of the offense and defense’s behavior when playing with, and against, the running game. Below we will give these rates as averages, as well as let you know their celeration rate, AKA, the rate at which they are improving or regressing week to week.
Lastly, we will provide bounce rates. This is a measure of consistency and the strength of a team’s internal control, or ability to withstand external forces or outlier events.
Detailed definitions for all of this can be found in our glossary of terms.
Chiefs Applied Rushing Behavior: NFL Analytics

Full season Average Rushing Yard Behavior (per minute of possession time)
%
Rushing Yard Behavior Celeration Rate (Week to Week Improvement/Regression)
Average Rushing Touchdown Behavior Rate (per minute of possession time)
%
Rushing Touchdown Behavior Celeration Rate (Week to Week Rate of Improvement/Regression)
3 Key Insights
1. Chiefs Made Commitment After The Bye Week
Yes the Chiefs Rushing Yard Behavior and Rushing Touchdown Behavior each grew over the course of the season, which is a good thing.
But it is even more impressive when you compare what they were doing going into the bye week, and what they did afterwards.
Going into the bye week, they were regressing at scoring rushing touchdowns by 22% week to week. Even worse was the 24% week to week regression in Rushing Yard Behavior.
Since the bye week, their Rushing Yard Behavior is improving 5% week to week, and their Rushing Touchdown Behavior is improving 1% week to week. That may not seem like a lot, but relative to the bye week that is a 39% and 30% difference respectively.
Those improvement rate turn arounds have also come with increases in their averages. Since the bye week, Rushing Yard Behavior average is up 11% from before the bye week, and their Rushing Touchdown Behavior average is up 34%.
2. Chiefs Rushing Offense Better, But Not Consistent
Bounce Rate is what we use to measure the consistency and stability of performance. Typically anything under x2 (read “times 2”) is seen as very stable. It means all possible outcomes are likely to be under a multiple of two away from the most likely individual outcome.
The bounce rate for the Chiefs Rushing Yard Behavior for the full season is x2.8. Since the bye week is x3.1, a 41% increase from before the bye week.
This means that as they got better in their Applied Rushing Behavior, they also got more unstable. This is not uncommon. They obviously made a substantial change to their environment, which while improving performance, that can create some level of instability.
On the positive side for the Chiefs, this seems to be cause by a large increase in high performing occurrences. Before the bye week, they only had two performances above 4 yards per minute in nine games. After the bye week they had five performances above 4 yards per minute, three of them in their last four.
3. Since Bye Week, Chiefs Getting Better At Scoring Touchdowns
Since their bye week the Chiefs have been 22% better week to week in scoring rushing touchdowns relative to fumbling the ball in the running game.
In fact, running he football is the safest way for the Chiefs to not only control the clock, but to maintain possession. They had 20 fumbles in the regular season. Only one of them came from the running game. When you combine the fumbles with the interceptions, the ball security of the running backs is a huge benefit.
That may be a massive anecdote in this Super Bowl. The Chiefs have gone run heavy in the playoffs. For the course of season the Chiefs ranked 26th in running play percentage, with 39.76% of their play calls being running plays.
In the playoffs they have increased that to 46.15%, which is even more than the 49ers over their last three games.
NFL Analytics: 49ers Applied Rushing Behavior

Full season Average Rushing Yard Behavior (per minute of possession time)
%
Rushing Yard Behavior Celeration Rate (Week to Week Improvement/Regression)
Average Rushing Touchdown Behavior Rate (per minute of possession time)
%
Rushing Touchdown Behavior Celeration Rate (Week to Week Rate of Improvement/Regression)
3 Key Insights
1. The Niners Know How To Run The Football
The 49ers were among the best in the league with a 4.416 yard average per minute in their 18 games this season. While that is impressive enough, it is even more impressive is to grow on that average.
Week to week they improved 3% over the course of the full season.
What’s even more impressive than that?
Their Rushing Yard Behavior had a bounce rate of x1.7. Anything under x2 is considered very stable with a strong internal control, impervious to external factors like opponent quality and location.
The Chiefs defense has been getting better by 2% week to week at preventing rushing yards, giving up on average a full yard less per minute than what the 49ers average. These two will converge in the Super Bowl.
2. 49ers Score A Lot Of Rushing Touchdowns
We all know that Christian McCaffery garnered a lot of MVP support in large part due to the gaudy 21 rushing touchdowns he had.
But as a team, they only had one game the entire season where they didn’t score a rushing touchdown. By comparison, the Chiefs had NINE.
The 49ers had eight games where they scored two or more touchdowns. The Chiefs had two.
3. 49ers Rushing Yard Prevention Behavior Is In Serious Regression
The 49ers defense is certainly one of the top units in the NFL. However, since their bye week, their rush defense is quickly becoming a liability.
Over the course of the full season, the 49ers were getting 20% worse week to week at preventing rushing yards. After their bye week, their regression has been more than twice that at 46% regression week to week.
Their pass defense has gotten better week to week by 2%, but that level of regression in their rushing yard prevention behavior could prove pivotal in this game. They average allowing three yards per minute of opponent possession time. But with their regression, they are projected to give up 4.65 yards per minute in the Super Bowl.
NFL Analytics: What Does This Mean For The Super Bowl?
On paper, and by average, the 49ers should have a clear advantage in the running game. However, when looking at the behavior of both the offenses and defenses in this matchup, they may be ceding it away.
The 49ers have shown no improvement or regression in what is a very potent Rushing Yard Behavior profile. The Chiefs defense, though, is trending in the right direction to possibly limiting that potency.
Not only have they lowered their average Rushing Yard Prevention Behavior rate by 17% since their bye week, they’ve also added a 2% week to week improvement rate.
What’s more for the 49ers, is that having a potent rushing attack is really only helpful if your defense isn’t allowing the damage that you’re doing to your opponent right back to you.
At a 46% week to week regression rate since their bye week, the 49ers rushing defense is converging at a moment in time when the Chiefs have upped their average Rushing Yard Behavior Rate 11%% over their last 10 games, with an improvement rate 39% faster over that span compared to their regression rate before the bye week.
The Super Bowl is not where you want your strength to cede ground to your opponent. But based on behavior profiling of these trends, that may be exactly what is happening, at the worst possible time.
In the 49ers favor: the Chiefs instability with an high bounce rate. They are susceptible to outlier performances. But of late, those outliers have been net positives for them.
We expect the rushing game for both teams to be the focal point and primary mode of offensive delivery. Expect both teams at or over 45% of play calling as they try to control the clock. It looks like the Chiefs may be stealing the advantage.
READ MORE
The Latest Behavioral Analysis Exclusively Here At Football Behavior
Kirk Cousins, The Shanahans, And The QB Collective: Player vs. Environment
Kirk Cousins career has been influenced by the Shanhans since day one back in 2012 when he was drafted by Mike Shanahan. 🎥 WATCH: Player vs. Environment Ep. 3: Cousins and the Shanahans The Shanahan Influence and QB Collective The story of Kirk Cousins...
Justin Fields Leaving Bears Was Best Thing For His Future
No, trading him wasn't the problem. In fact, that was probably the best thing they could have done for him. 🎥 WATCH: Justin Fields Needed New, Better, Environment In the highly competitive world of the NFL, the trajectory of a player's career can often hinge on...
Falcons Sign Kirk Cousins: This Is The Way
The Falcons have disappointed in their seasons under Arthur Smith. They have been competitive in the most mediocre of ways, but wins are what pays the bills and keeps jobs. Enter Raheem Morris. Immediately he has identified how much better this team would be...

