Our goal at Football Behavior is to help sports bettors better understand the environment NFL teams behave in, how they behave, and most importantly, how to predict how they will behave in the future. That is where our sports betting models come in.
Why Sports Betting Models?
Bettors typically place bets when they have the greatest understanding of all of the different variables that could impact the environment of a particular game. To do this, bettors often seek out sports betting models for projections and predictions that have strong correlations with actual outcomes.
The Pigeon Picks Prediction sports betting model:
- Pays for itself
- Hit 67% on 300+ bets in 2022
- Had a 91% ROI
- Was ranked in the top 10 for ROI by SharpRank
- Get every final score prediction for every game, every week
- Weekly team behavior profiles to see how each team is trending
- Quarterback Props in all Primetime Games
- Much More!
What is a Sports Betting Model?

Sports Betting Models Use A Ton Of Data Points, But Are They The Right Data Points?
Like behaviorist B.F. Skinner established with his pigeon experiments all those years ago, living things are prone to superstitious behavior. For example, ancient peoples doing a rain dance. It only takes a minimal amount of reinforcement (like winning just a few bets out of many) to keep you coming back for more. When that happens we can fall into a pattern of flawed decision making.
Sports Betting Models Remove Superstition
Sports betting models take into account an incredible amount of data points relative to the outcome they are trying to project. Likewise, some betting sports betting models only select specific data points that align with what they believe to be most valuable to the outcomes they are predicting. In football, for example, those data points could be things such as yards gained, yards given up, penalties, starting field position, points scored, dewpoint at kickoff, etc.
They could also be standardized subjective analytics that have been created along the way like EPA, DVOA, WAR, etc.
Those who create sports betting models attempt to place relevant values on those data points to dial in their sports betting model at a level of accuracy suitable for them to make confident predictions.
As a behaviorist, I attempt to pinpoint specific observable team behaviors as objective data points to include in my Pigeon Picks sports betting model. Things like Scoring Behavior Rate (SBx) and Score Prevention Behavior Rate (SPBx), among many other things.
At Football Behavior, the Pigeon Picks Prediction sports betting model uses dozens of individualized behavioral data points for each team to project winners along the moneyline, against the spread (ATS), dutching winning margins, over/unders, prop bets, etc.
Using Applied Behavior Analysis To Build Sports Betting Models

Using The Science Established By B.F. Skinner, We Can Better Understand Football Behavior
B.F. Skinner is widely considered the father of applied behavior analysis (ABA). Today, ABA is often incorrectly exclusively associated with a therapy sports betting model for individuals with Autism. However, Skinner considered applied behavior analysis a natural science for understanding the behavior of all living things.
Science is based on collecting data on purely observable events, charting that data, and searching for trends that lead to projections of future behavior.
Football players and teams are living things. They have behaviors that are greatly influenced by the environment they are expected to perform in. ABA can help us understand them better.
Taking that knowledge, and then observing the team behaviors of all 32 teams in all 32 different environments that they operate in on a weekly basis, we have learned that some of those behaviors are more valuable than others in determining winners and losers.
How We View That Data
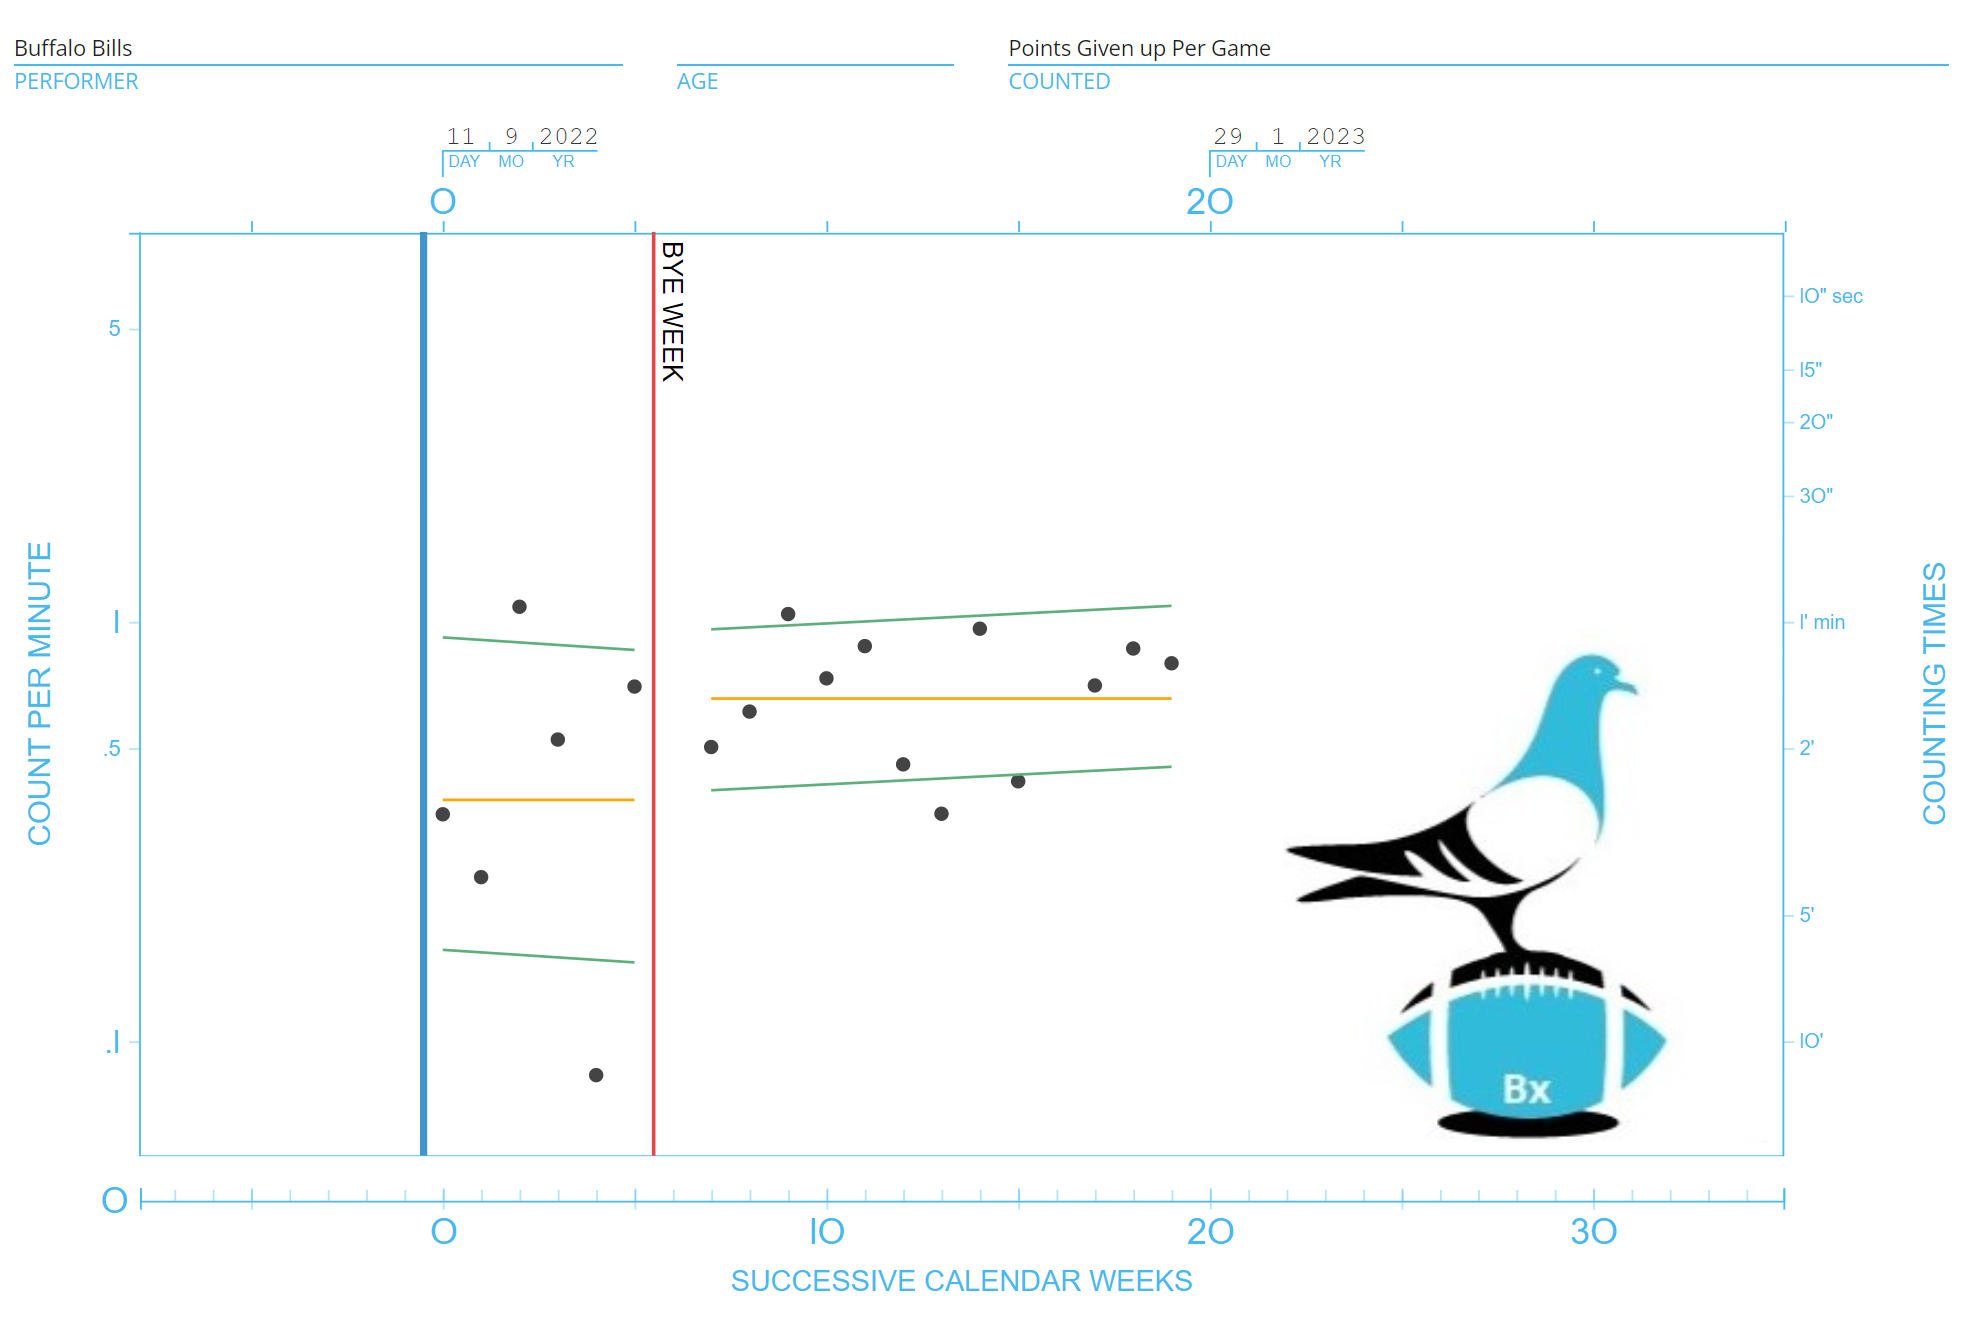
We’ve taken the data collected in our observations and put them in a sports betting model using a Standard Celeration Chart (SCC), which is a semi-logarithmic chart measuring the speed at which something is getting better or worse.

An SCC Helps In The Use Of Behavior Science In Sports Betting Models
This sports betting model gives me projections for expected behaviors of the teams in a few different areas that we use to bet against the spread, the moneyline, over/unders, dutching winning margins, and even some parlays. All of it is predicated on the principles of behavior analysis.
You can follow our sports betting model’s success every week by following me on Pikkit and upgrading to Pigeon Picks.
Explaining The Key Terms That Matter
Adhering to principles of applied behavior analysis partly means knowing what it is we are looking at when we analyze trends, projections, and expected outcomes. It is very important that we know the definitions of key terminology being used, not just for the person doing the modeling but perhaps even more importantly for you, the audience.
Some of the core elements of applied behavior analysis we look at are:
- Group behavior dynamics
- Environmental control of behavior and the impact of environmental changes
- Temporal Extent
- Repeatability
- Temporal Locus
Football Behavior has prepared a Glossary of Terms that include definitions and examples of key terms and Football Behavior’s proprietary metrics and analytics. All of these are very helpful to sports bettors, as well as give insight into what makes the Pigeon Picks Prediction sports betting model a winning sports betting model.
Frequently Asked Questions
Who created the Pigeon Picks Sports Betting Model?
As a behaviorist and the creator of the metrics for Football Behavior, Brett Yarris works directly with several NFL players. He works with them on technique and movement behavior for their positions. Working with them and their coaches has given me a front row seat to what they feel truly matters in deciding the outcomes of football games. For amount Brett, check out our About page!
Can you use this sports betting model to bet every single game played?
The short answer is yes. However, remember the bounce rate. We personally will not place a wager on a game where a team has a bounce rate over x3. Same if a team has a celeration in either direction over 2. This indicates high levels of chaos and outlier possibilities. If you follow me on Pikkit, we will always say which games we are betting on. We will also state what those numbers are as to how we selected those specific games. If we deviate from that, we’ll always be transparent about that.
What does a 90% confidence level for Bounce Rate mean on the chart?
This represents how “confident” we are in calculating this particular bounce rate. 90% is the standard for calculating a bounce rate. This means we are 90% confident that this is the correct range of outcomes for a projection. Anything that comes in outside of that range would be considered an outlier. Anything significantly out of that range would be considered an “extreme” outlier.

Hey Brett, very interesting read. Do you find there is more variability in the pro game versus the college game? From my experience nfl has been much more difficult to project versus cfb.
I think the parity in the NFL actually makes it harder to project winners and loser, or at least make assumptions about who they will be week to week. Across the NFL’s 32 teams, the variance in actual ability isn’t all that large. You don’t really ever get the Alabama vs Tennessee Southern State On The Western Coast University matchups. That’s why we try to look beyond the assumptions of who is good and who isn’t, and tease out exactly how each team behaves, to find that edge in a very narrow envelope of possibilities.